Advanced Reporting
When I joined Teachable, users did not have access to a robust analytics tool. This made it difficult for schools to analyze their customer data.
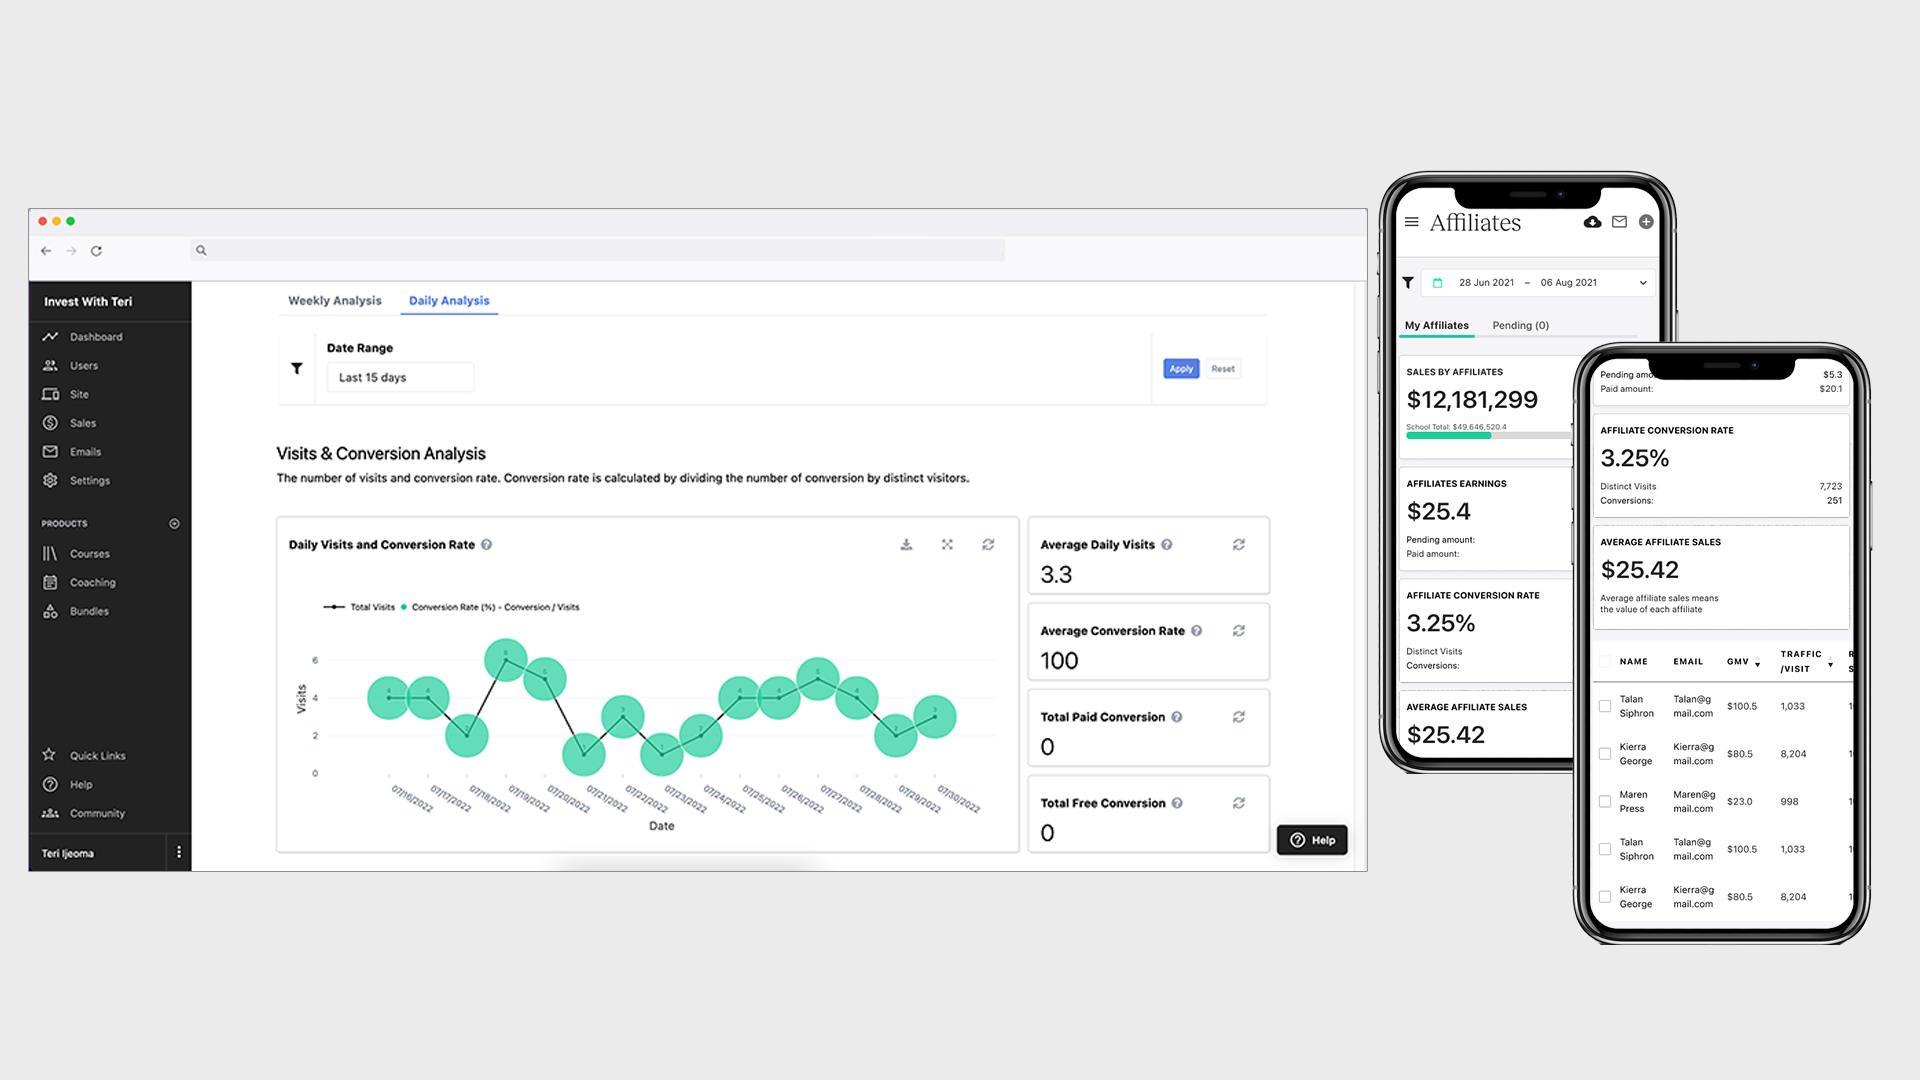
I designed the “Advanced Reporting” service, which gave our users easier access to their data so they could better understand their business.
This product garnered overwhelmingly positive reviews and showed 87% user engagement compared to the previous 20%.
Problem Statement and Initial Research
What should we provide? & How should we provide?
Before developing the product, I needed to make sure the metrics to be provided was inline with users’ actual demands.
To identify users’ overall data usage pattern and their expectation, user interviews were conducted.
Research Goal
Evaluate interest and usefulness of different dashboards and visualizations
Get initial feedback on clarity and level of intuitiveness of metric combinations
Identify Alternative / Work-around tools that users are using to find an opportunity
Research Design
‘Low-fi’ design iterations are shown to the interviewees to make sure if the initial approach is in line with users’ demand.
During the interview process,the interviewees are asked to choose an option which is close to their expectation.

Traffic & Conversion Drilldown

Product Drilldown

Marketing Drilldown
Research Method
Recruiting Criteria:
School with at least 6 months of sales
Release new course in the last 6 months
At least 100 students
GMV-generating course
Group 1: Use UTMS
Group 2: Does not use UTMS
Interview Questions
How are you currently measuring the success of your school?
Are you currently using an analytics tool? If you are already using one, What do you like and what do you dislike?
Among the three options, which metrics do you think the most relevant to your data needs?
Can you imagine the ways you could use this analysis?
Research Take-away & Analysis
Throughout the interview process, I could identify that there are different types of users having different demands. The common ground among the different type of users is that
a simple data delivery tool is demanded and even for the advanced users integration between Teachable platform and other analytics tools is challenging.
User Personas
Users are categorized into different groups by its' Data literacy’, ‘Marketing Knowledge’ and ‘Data usage’
Those shows high level of understanding on all the fields requires highly complicated data analytics models that we can’t currently deliver. So for this iteration, the groups is not considered for this launch process.
“I don’t know what data to even look at”
“I only need numbers and statistics based on dates range”
“I want to know which one has been successful”


Development Direction
The development decision was made considering two factors
Technical Feasibility
The current data base doesn’t provide precise UTM-Triggered data
Astrobox Library has limited features for visualization products
Use case
Marketing deep dive data is targeting advanced users plus, the number of users adopting UTM is relatively small
Traffic and Conversion data is what majority users are expecting


Development Direction Metrics
Prototype
First Iteration
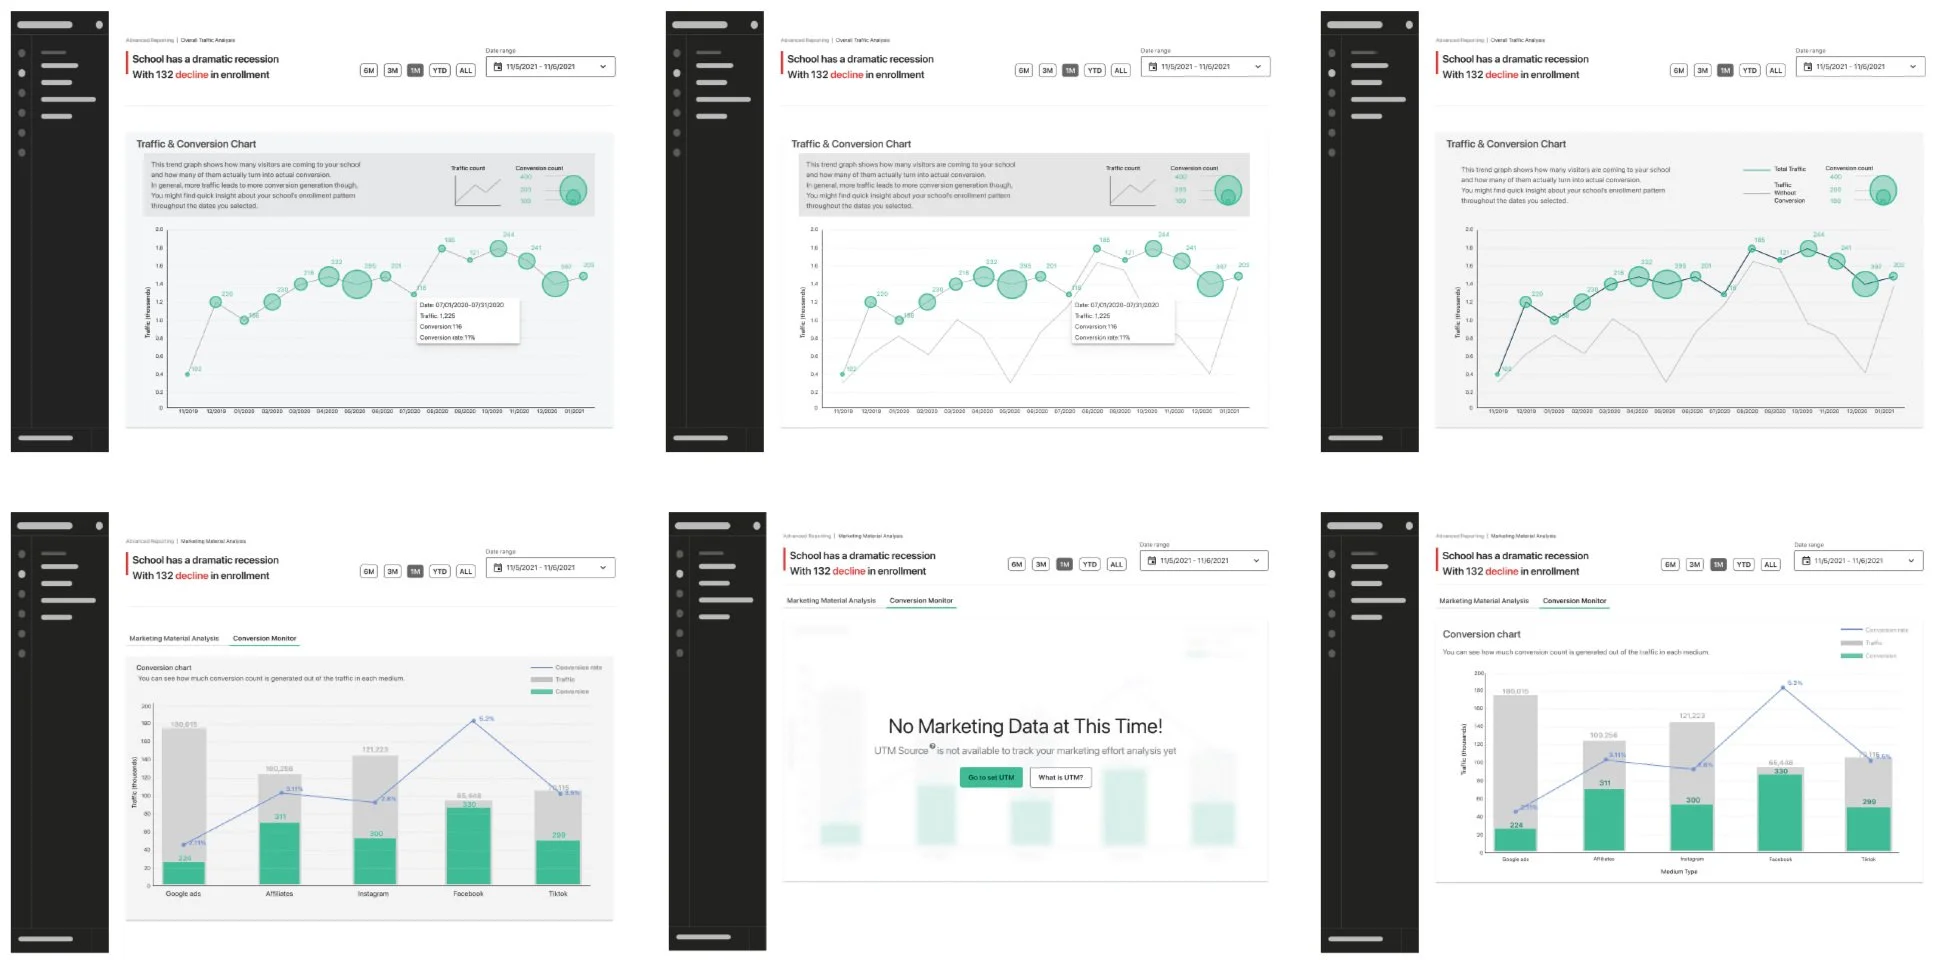
‘High-Fi’ Prototypes are made. For this iteration, technical feasibility as well as legibility with actual sample data set are tested.

Short list for final testing
Two possible options are left. Considering the range of the value sets for both ‘traffic’ and its ‘conversion’, Bubble chart & Line graph combination was selected.

Usability Test
After developing the first iteration, usability tests were conducted with the internal users. The participants of the tests were selected ranging from heavy data-users to light data users. The interviewees were given the dashboard link and asked to clear certain tasks which are desired activities while using the product.

Usability Test Metrics
Usability is assessed by ‘critical error’ and ‘non-critical error’ as well as subjective evaluation
Product Launch
Alpha Launch and User Monitoring
Out of around 40k active subscribers, about 2k were detected using UTM codes. To have broader and general use case for the first round of Alpha launch, we decided to have metrics that could be applicable to all the audience, which is traffic and conversion in school level. The alpha launch is planned as 4-week long trial period
1. Schools Selection Criteria
Sorting out schools with the following criteria.
Life time GMV is greater than $100
Created courses generating GMV within last 3 months
2. Research Goal
During Alpha Launch, our goals were
Monitor users' interaction to identify usability issues and bugs
Guide users how to use the report and collect direct feedback about the product
Measure the engagement level of schools
3. Success Metrics
The percentage of schools having engagement score more than 2*
(If a school visits Advanced Reporting at least once during a week, it is recorded as score 1. If a school visits the reporting more than once a week for the 4-week long test period, the school would have score 4)NPS / Direct feedback regarding user satisfaction
4.Research Tools
Fullstory- Monitor users interactions and identify frequent usability issues
User Interaction MonitoringPendo - User guide for Advanced Reporting
Weekly Email - Share the updates & bug fixes with users and collecting direct feedback and requests
Sigma - Track the user logs with Advanced Reporting

Usability Issues by occurrence & severity

Summary of Usability Issues
5. Launch Result and Follow up
Results
78% of schools used the product
58% retention rate after the first week
The number of active schools gradually
decreased over the alpha period
Post Launch Questions
“Does the lower visits mean lower value?”
“What drove the decline in engagement?”

User Engagement during test period
Conclusion + Take-away
Potential Value of the product
“Some school owners value convenience over a super-powered tool. (Opportunity)”
I used to think that school owners would prefer use powerful integrations, now I know that some school owners value convenience over a super-powered tool.
The schools I spoke to all have an additional Wordpress or Squarespace site with Google Analytics set up, but not their Teachable site. Even if they did have it set up on Teachable, I learned from previous interviews, they worry if they had set it up correctly.
Low usage≠Low engagement
I initially thought that schools with less frequent usage did not find the dashboard useful.
I learned that some schools preferred checking data more often than others, but generally it was closer to monthly.
Most of the time, activity is triggered by “special events” such as new course launch, or special promotions. This is supported by other research that show that more schools are moving towards a launch model.
Instead, schools at different stages have different needs.